
Interactive maps and media were produced for the purpose of teaching and engaging students in a more authentic non-scripted manner than traditionally presented case studies. It prepared students for future education policy fieldwork, a process where often a clear path and direction for analysis is not immediately evident and must be improvised and iterated upon.
Obstacle
As an example of a traditional Case Study Environment, fifteen curated articles and readings are given to a student as part of a syllabus to analyze throughout the course of an education or policy environment. In preparation for the course, one of the POLS professors thought this approach to be too staged and sanitized in a “tidy narrative”. Contrast this with real-life policy decisions, where one must find hidden data points, analyze the community perspectives, and explore the history of a region. What would provoke a more natural exploration, an “experiential learning” approach versus the linearity of traditional education policy environment analysis? This central question guided the creation and development for what became the interactive case study maps.
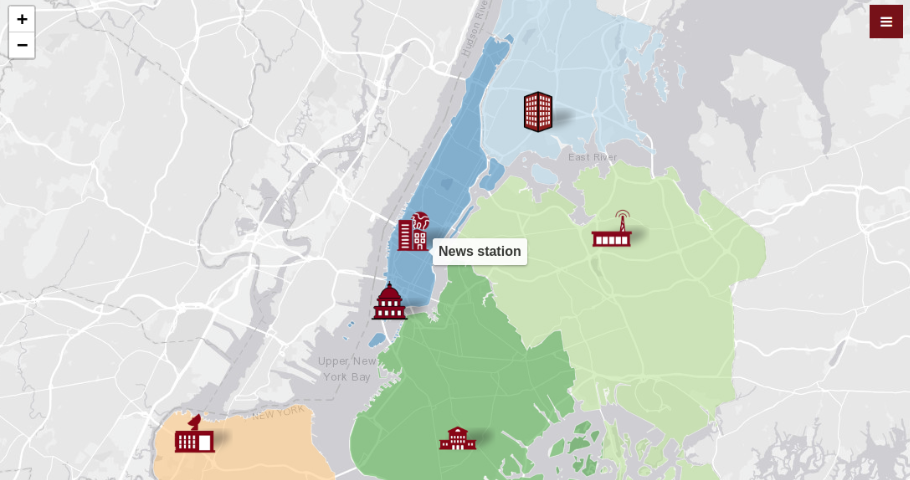
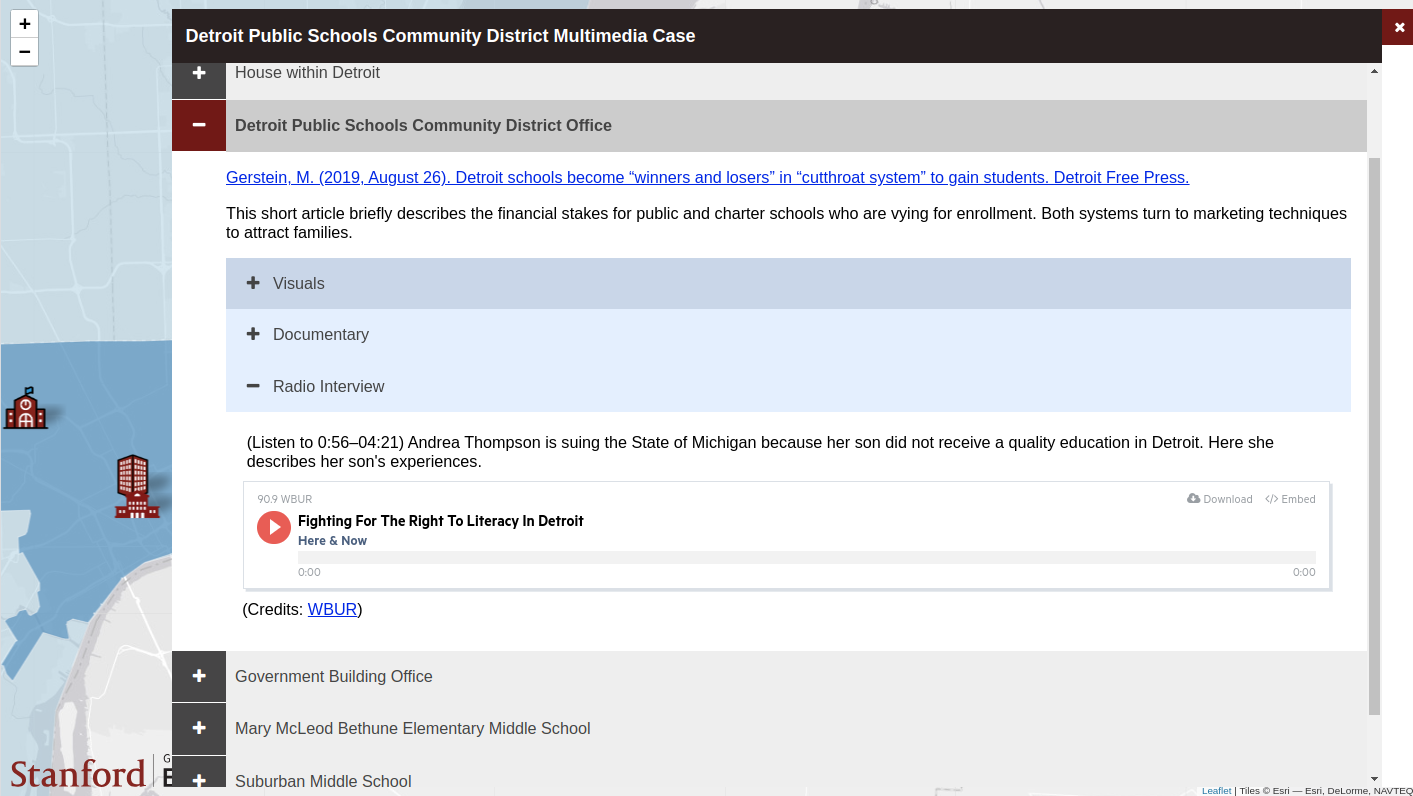
The professor would identify the geographic region for their case study, and then identify the areas they wanted to represent (e.g. school, government building , airport, neighboring Indian tribe, etc). The GSE IT Project Manager and video editor would consult with the professor and TA to determine what type of map, assets, and media content would fit well with the project. Subsequently, the technologist would develop the map, and the means by which to represent them with a geographic swath, icon on a map, or color-coded region. Open access data and software were used such as OpenStreetMaps based maps and public access GIS geojson datasets. A corresponding menu bar would be developed to represent content featured in the map, e.g., videos, audio clips, images, and PDF’s.
We gave consideration to see where the interactive case study maps would fit in with the live in-class lesson as well as the web-based learning management system. Ultimately, we followed a pre-determined schedule provided by the professor to publish a new case in the Canvas course in tandem with the corresponding live class discussion. Critical to the project was continuous dialogue with Professor and TA, project management software to coordinate updates, and verification of assets and content.
For students, this interactive case study approach solicited more discussion within large group and small group breakout sessions. At first it was a bit challenging to students that expected a more linear and directive approach. However, afterwards, students warmed up to the exploratory approach, and it provoked natural questioning and conversations about the geographic context of case study assets. In Professor Pearman’s class, one student stated it was their favorite course during their time studying at Stanford.
From Pearman: “We took notable risks with this course in terms of rethinking how education policy could be taught and engaged with. Considering how students responded, those risks were well worth it.”