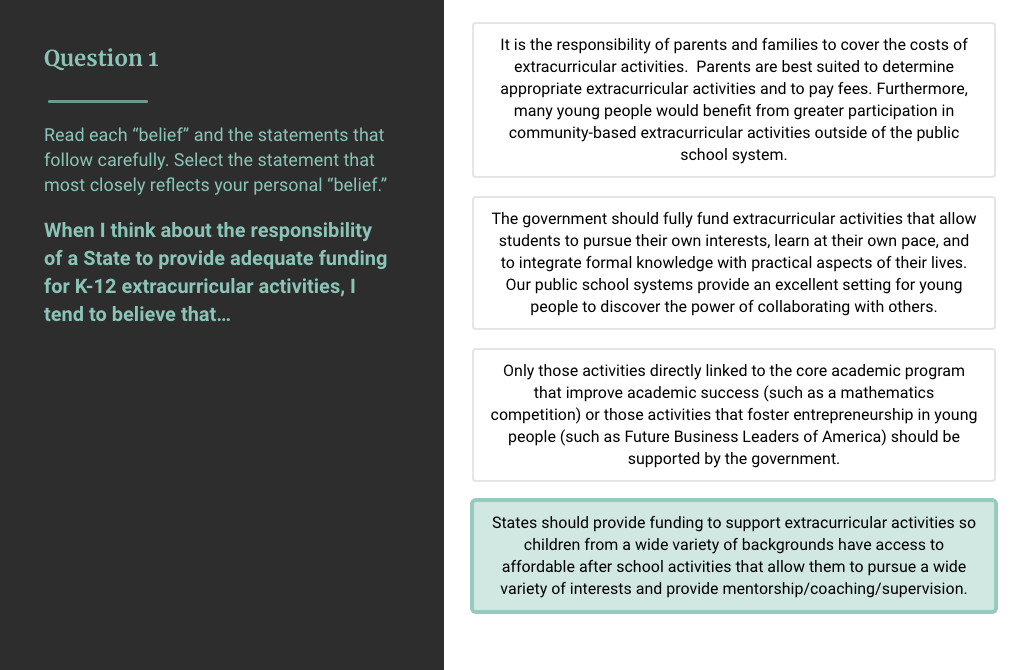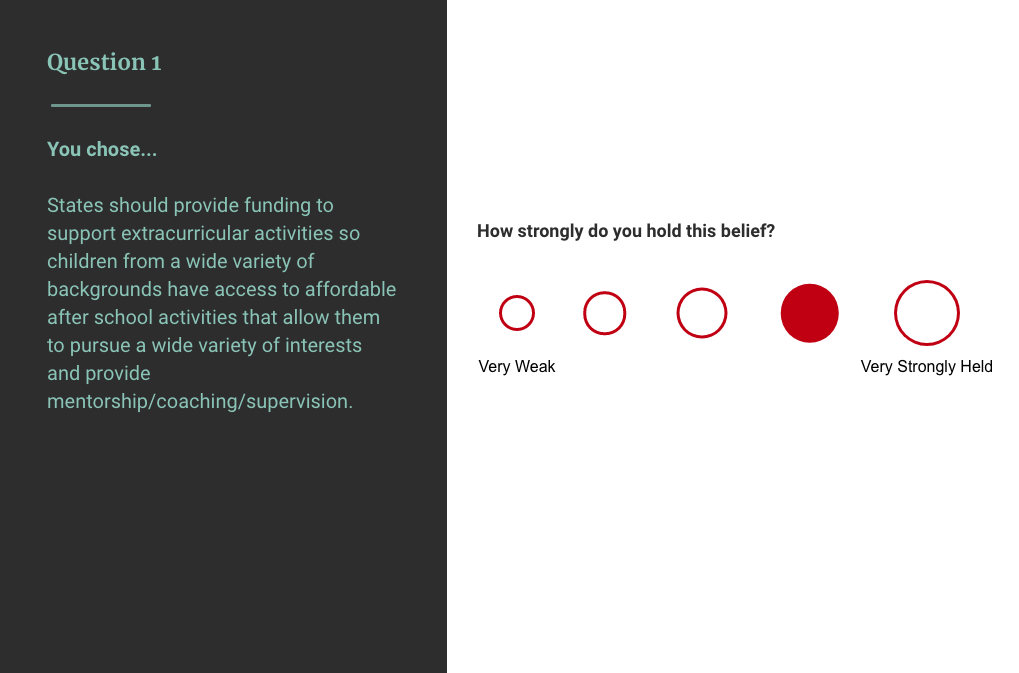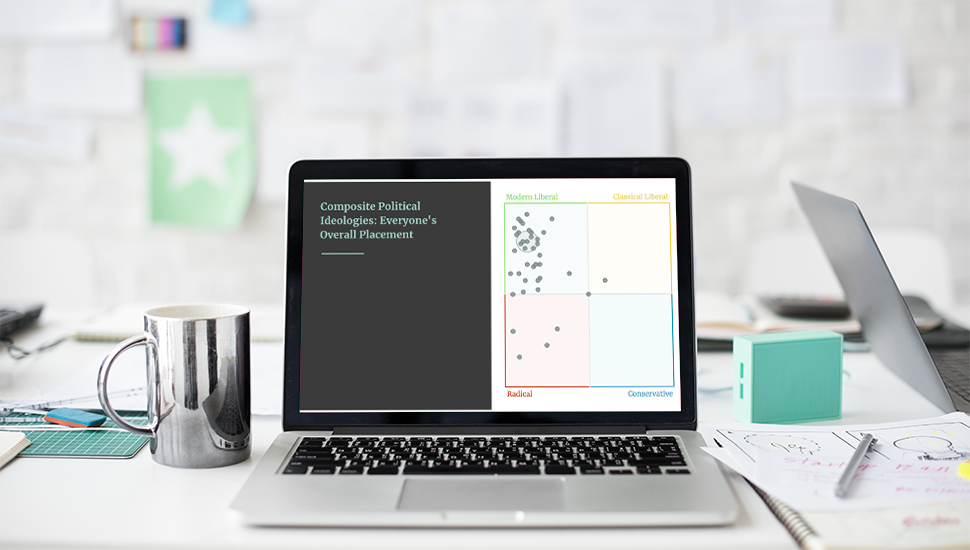
The Ideology Diagnostic is a web app that collects and displays aggregated group responses about political beliefs.
Thomas Ehrlich, former Dean of Stanford Law School, utilizes this custom app and data visualization tool to counteract stereotyping and promote civic discourse in instructional settings. Professor Thomas Ehrlich inherited code from researchers at a peer institution and asked for GSE IT assistence in iterating and deploying the code, as well as designing a mini-curriculum around the experience.
Scope
GSE IT met with Prof. Ehrlich and the original content creators at Keene State College to understand the code base and Smart Sparrow, the adaptive learning platform on which it was built, before handing off the app for iteration. Upon inheriting the code base, GSE IT and Prof. Ehrlich mapped out a novel end-to-end digital experience, including learning objectives and workshop design. GSE IT then project managed the build process and administered the deployment using Smart Sparrow’s web engine.
GSE IT developed the learning app alongside Prof. Ehrlich via multiple stages:
- Ideated extensions to Phase I of online learning experience
- Devised online-offline flow of information for participants
- Liaised with original content providers to mold new learning experience
- Managed software development of new data visualizations
- Administered session-by-session roll-out with new online and offline workshop groups
Quote from Prof. Ehrlich:
“It shattered the pigeonholing that many of the students fall in to about themselves and others.”
Tools and Technologies used
Google Drive
JavaScript
Smart Sparrow adaptive learning platform
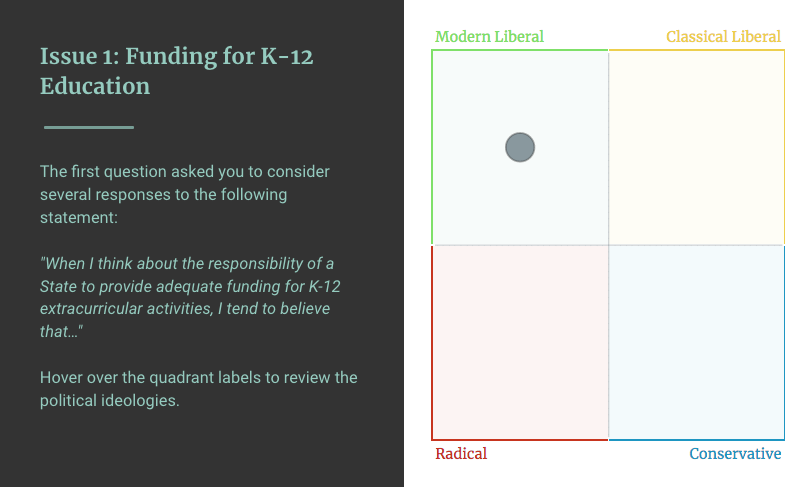
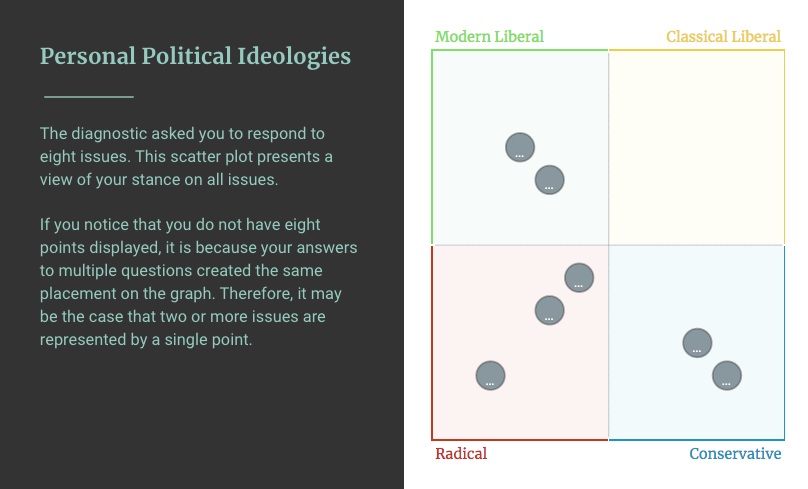
The app has gone through two successful iterations to expand UI and UX. An additional screen displaying a personalized composite score averaging each individual’s response was created, as well as a scatterplots of cohort-wide responses issue-by-issue and average-per-user. Cleaner visualizations and interactivity fields have been implemented.
Overall, Prof. Ehrlich has taken advantage of these additional analytical tools to drive discussions across multiple deployments with undergraduates, graduates, professional conferences, and career institutes.
